
Terravision · Satellite mineral mapping
Satellite drill-target mapping for mining and geothermal exploration.
Terravision maps surface alteration from NASA EMIT hyperspectral, ASTER and Sentinel-2 imagery, adds fault and lineament mapping from high-resolution terrain data, and returns a short list of ground worth visiting. Delivery is within 48 hours of a confirmed boundary.
A short list of places to look, from orbit.
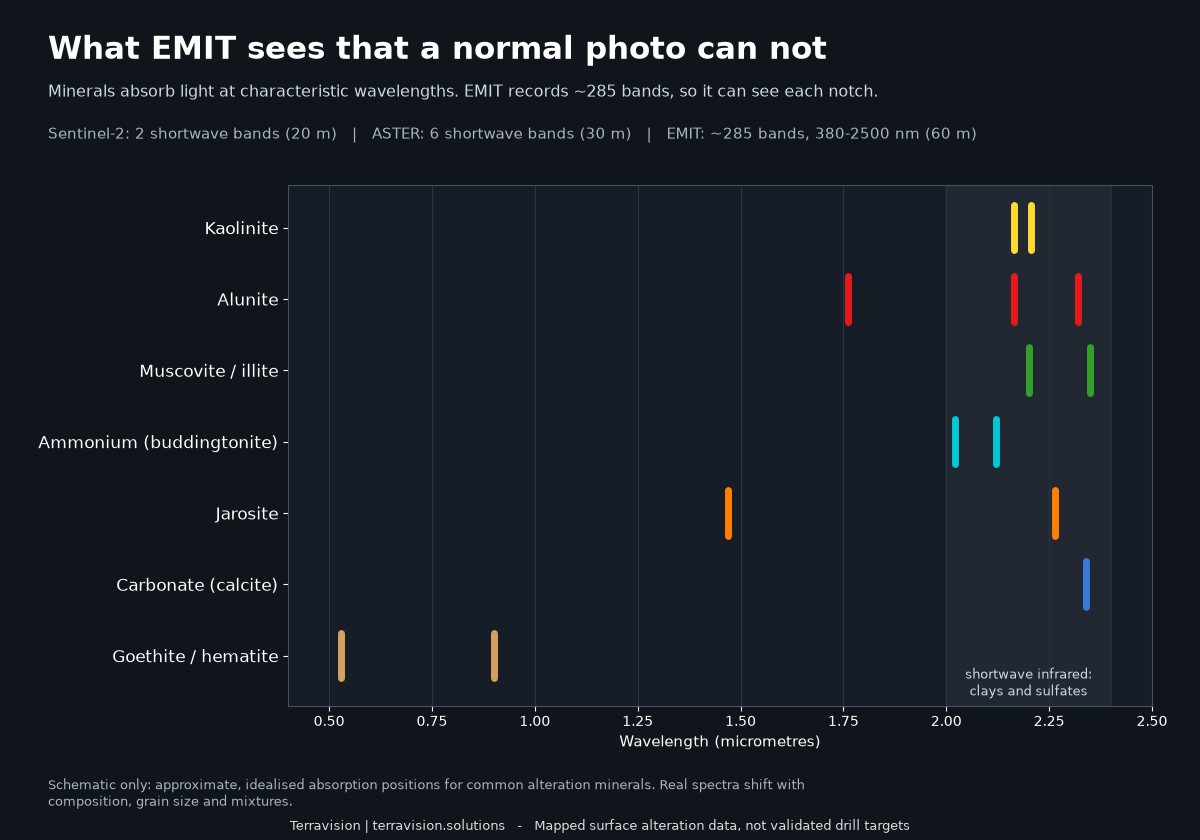
Hydrothermal fluids leave chemical fingerprints at the surface: clays, sulphates, iron oxides. Those minerals absorb sunlight at particular wavelengths, and a satellite can read that. We turn that signal into maps you can open in Google Earth, QGIS or ArcGIS.
Every delivery says plainly what the data shows and where it stops being useful.
| Sensor | What it gives us | Ground size |
|---|---|---|
| NASA EMIT ISS imaging spectrometer | About 285 bands from 380 to 2,500 nm. Identifies individual minerals (alunite, kaolinite, muscovite, jarosite and others) from their absorption features. | 60 m |
| ASTER NASA / Japan, Terra satellite | Archive shortwave-infrared bands for clay, carbonate and silica indices, plus thermal bands. Its SWIR detectors stopped working in 2008, so this is a fixed archive. | 30 m |
| Sentinel-2 ESA, Copernicus | Fresh, frequent coverage almost everywhere. Good for iron oxides and a broad clay signal; it can't separate one clay from another. | 10–20 m |
| Terrain structure Elevation and LiDAR where available | Fault and lineament mapping from high-resolution terrain data, used alongside the alteration layers. | varies |
Look at the district before you commission anything.
A map pack is a finished, documented set of layers for one district, ready to drop into your GIS. The first is Goldfield–Cuprite in Nevada, one of the best-exposed alteration districts anywhere. It's priced for quick, low-risk screening.
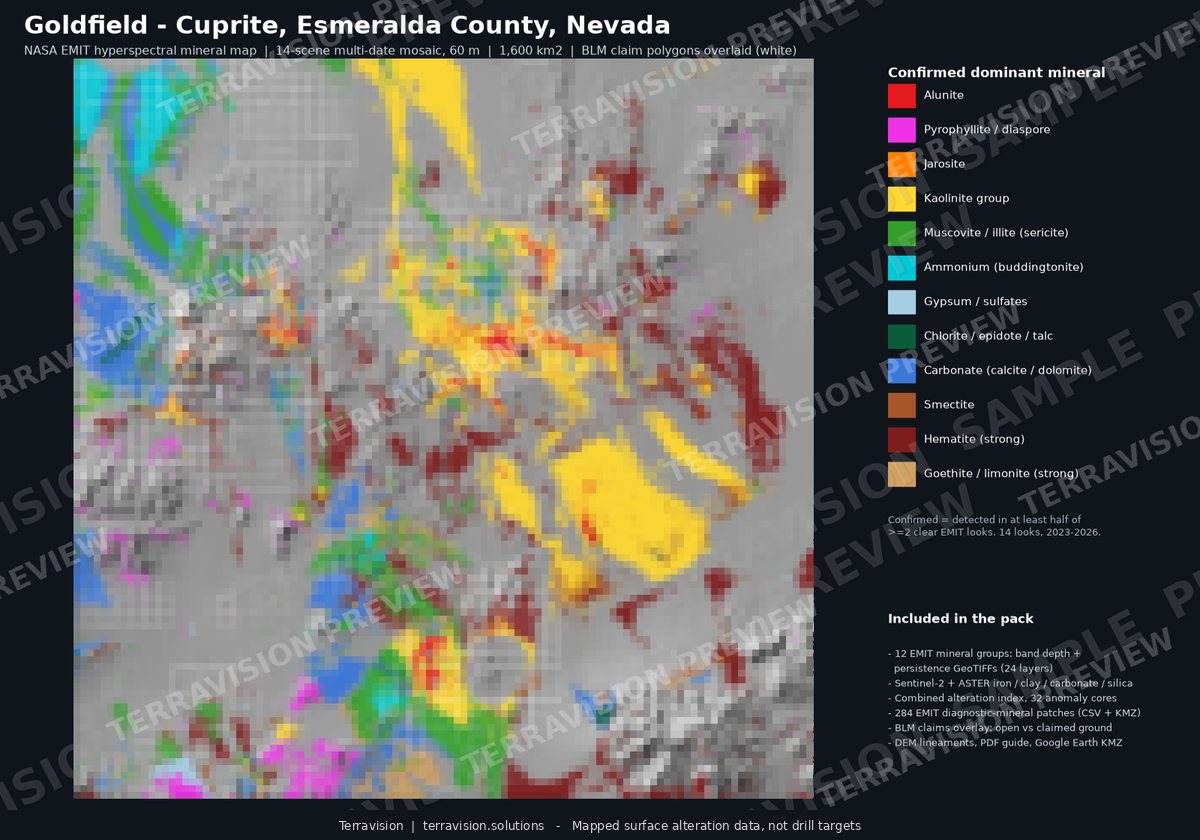
Goldfield–Cuprite, Nevada
EMIT mineral map pack · v1.1
| Area | About 1,600 km² at 60 m |
|---|---|
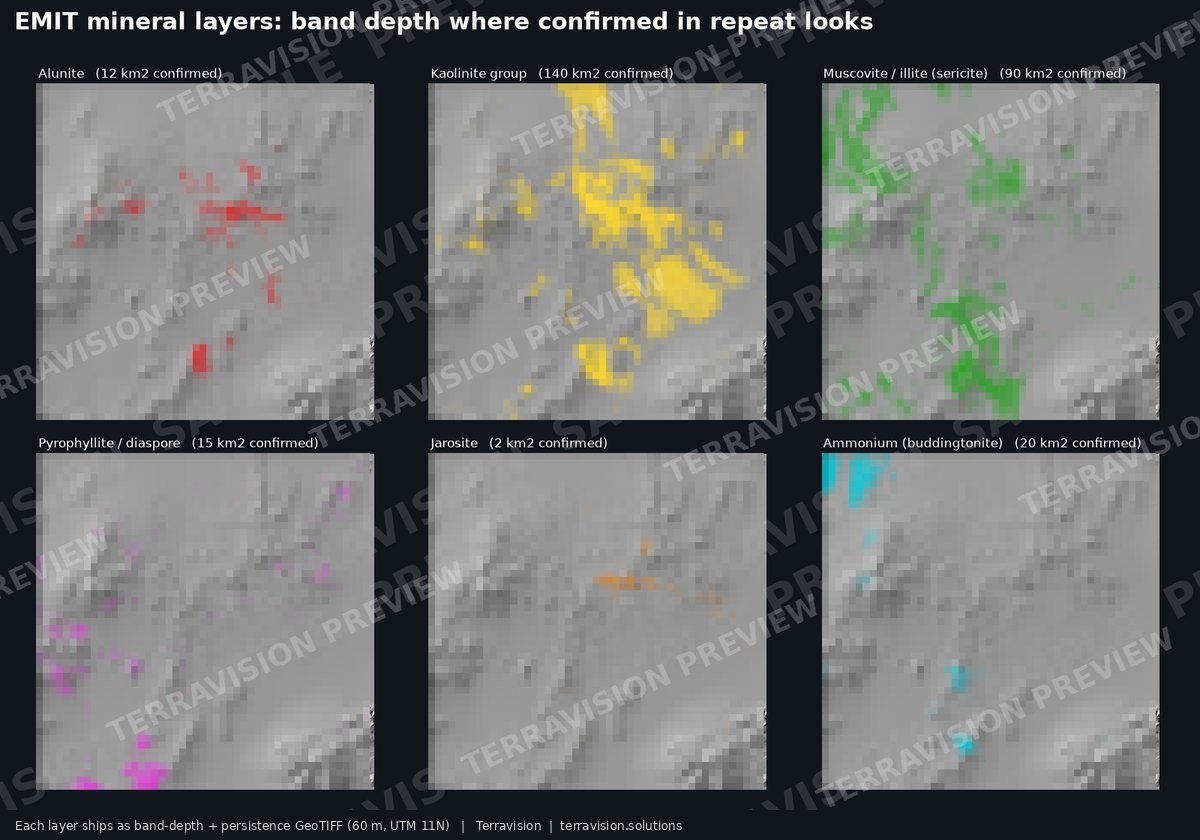
| Minerals | 12 EMIT mineral groups, band depth and persistence |
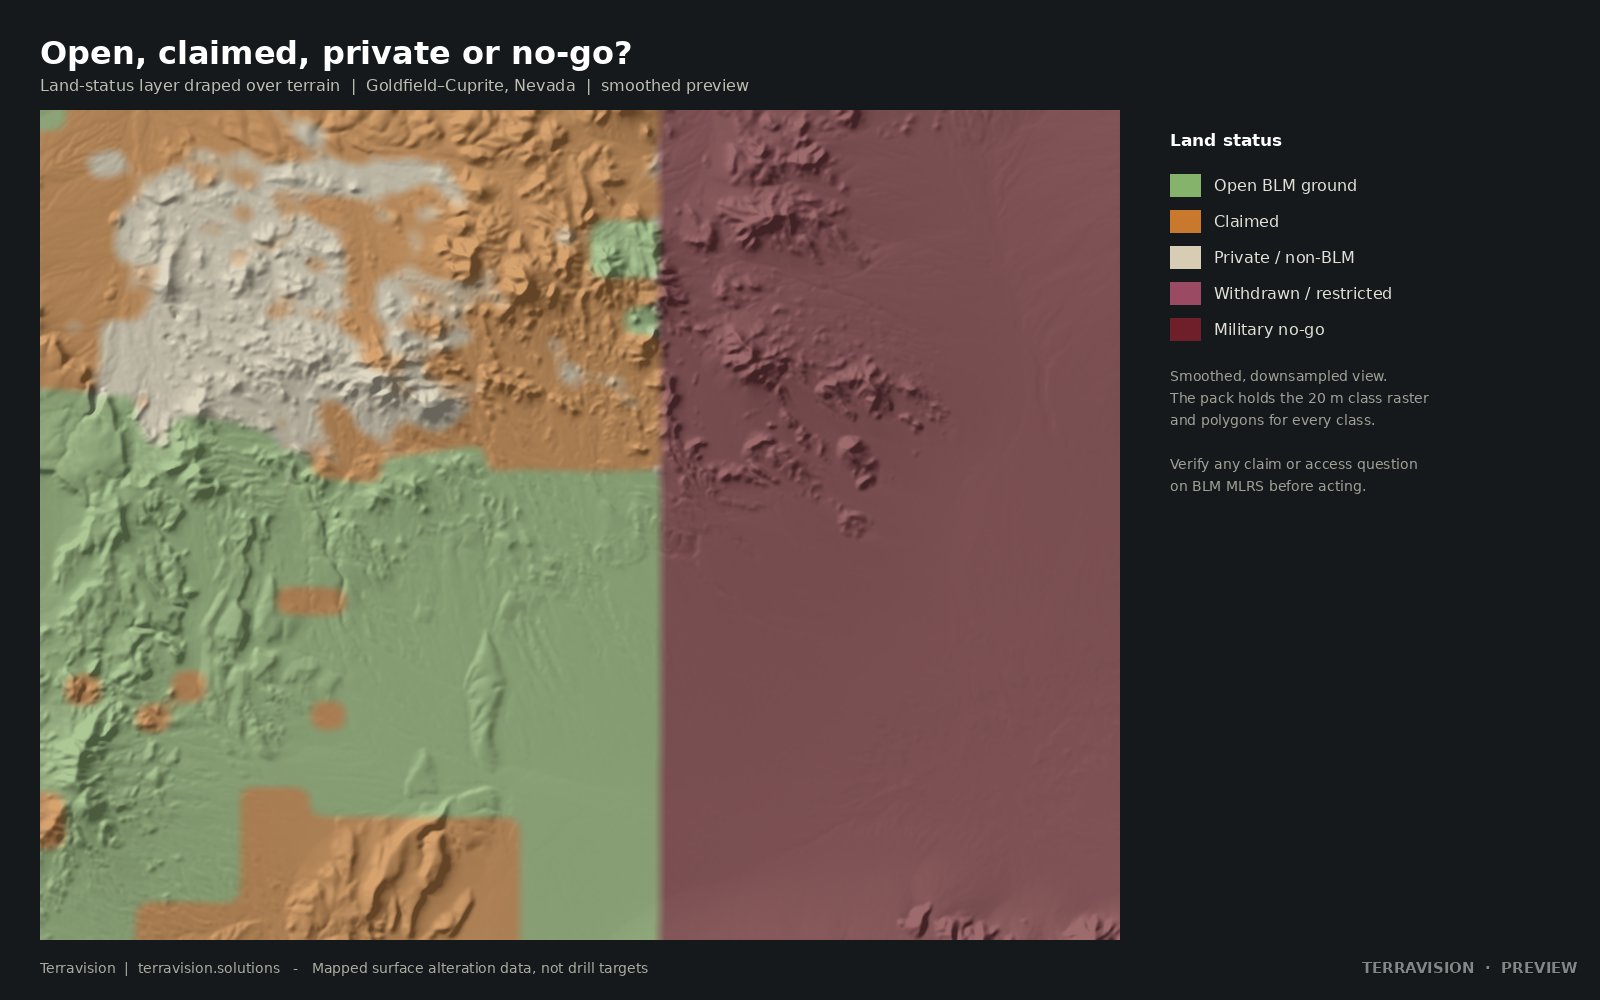
| Reference | 460 USGS known mines and prospects; BLM claims; land status (open, claimed, private, military no-go) |
| Formats | GeoTIFF, GeoPackage, KMZ, PDF method guide |
More districts
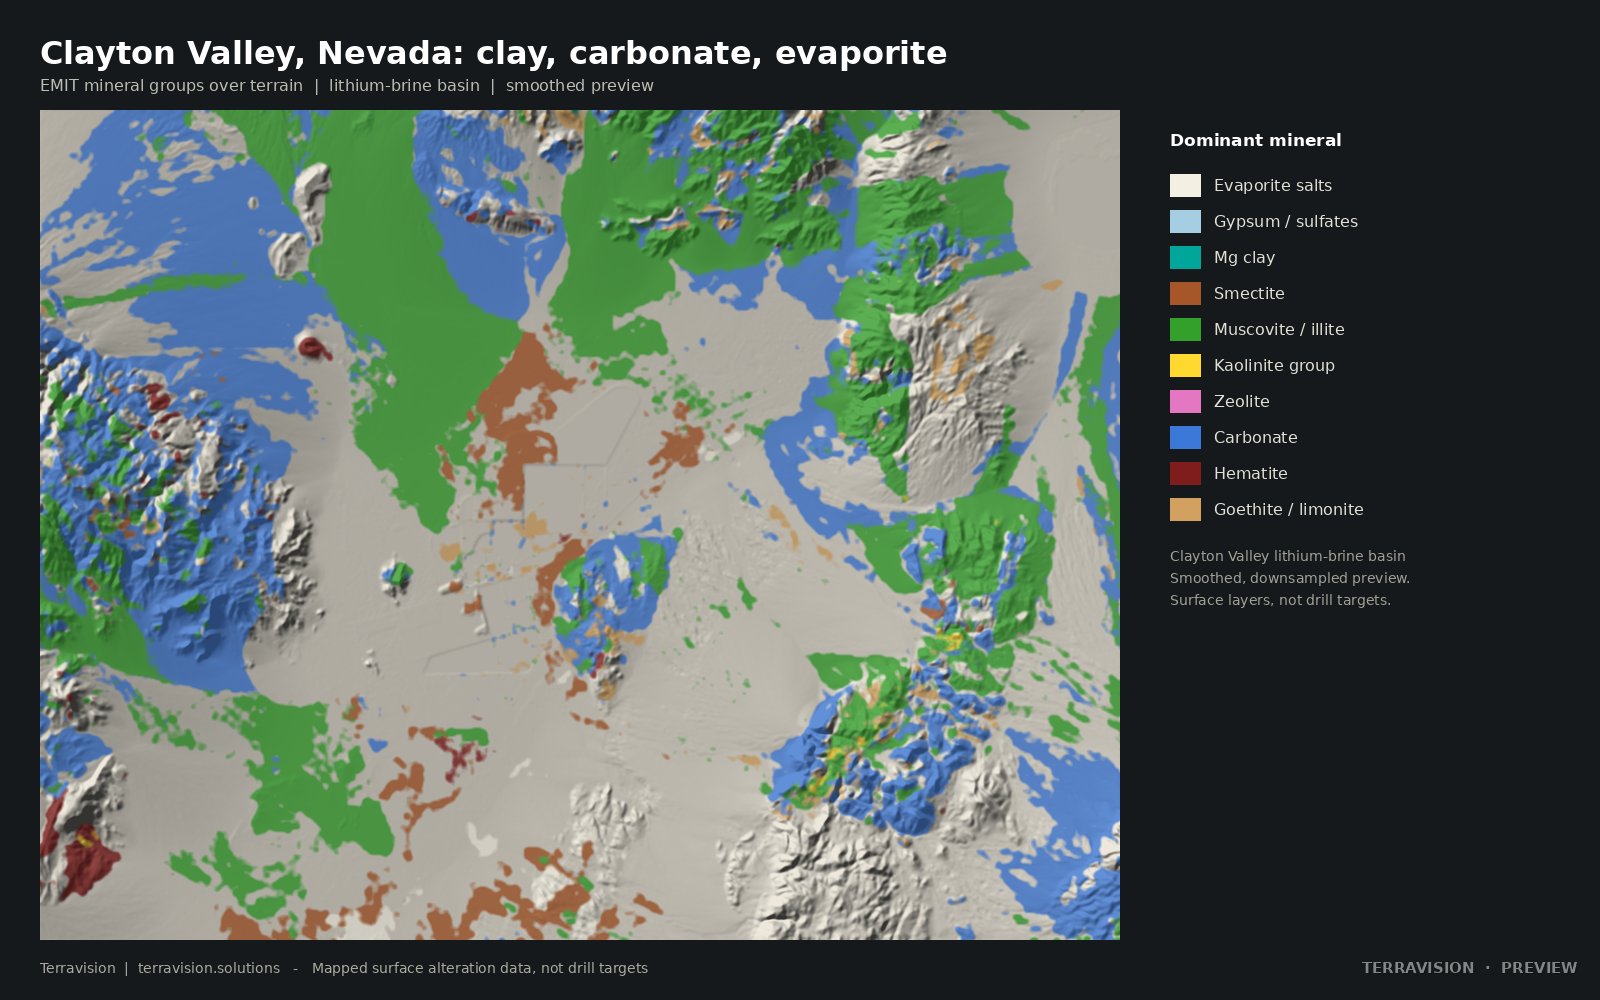
Clayton Valley, Nevada
The Nevada lithium-brine basin: clay, carbonate, evaporite and iron layers, claims, playa outline, known mines and a land-status layer.
$295 · team $795 · academic $99 · instant download
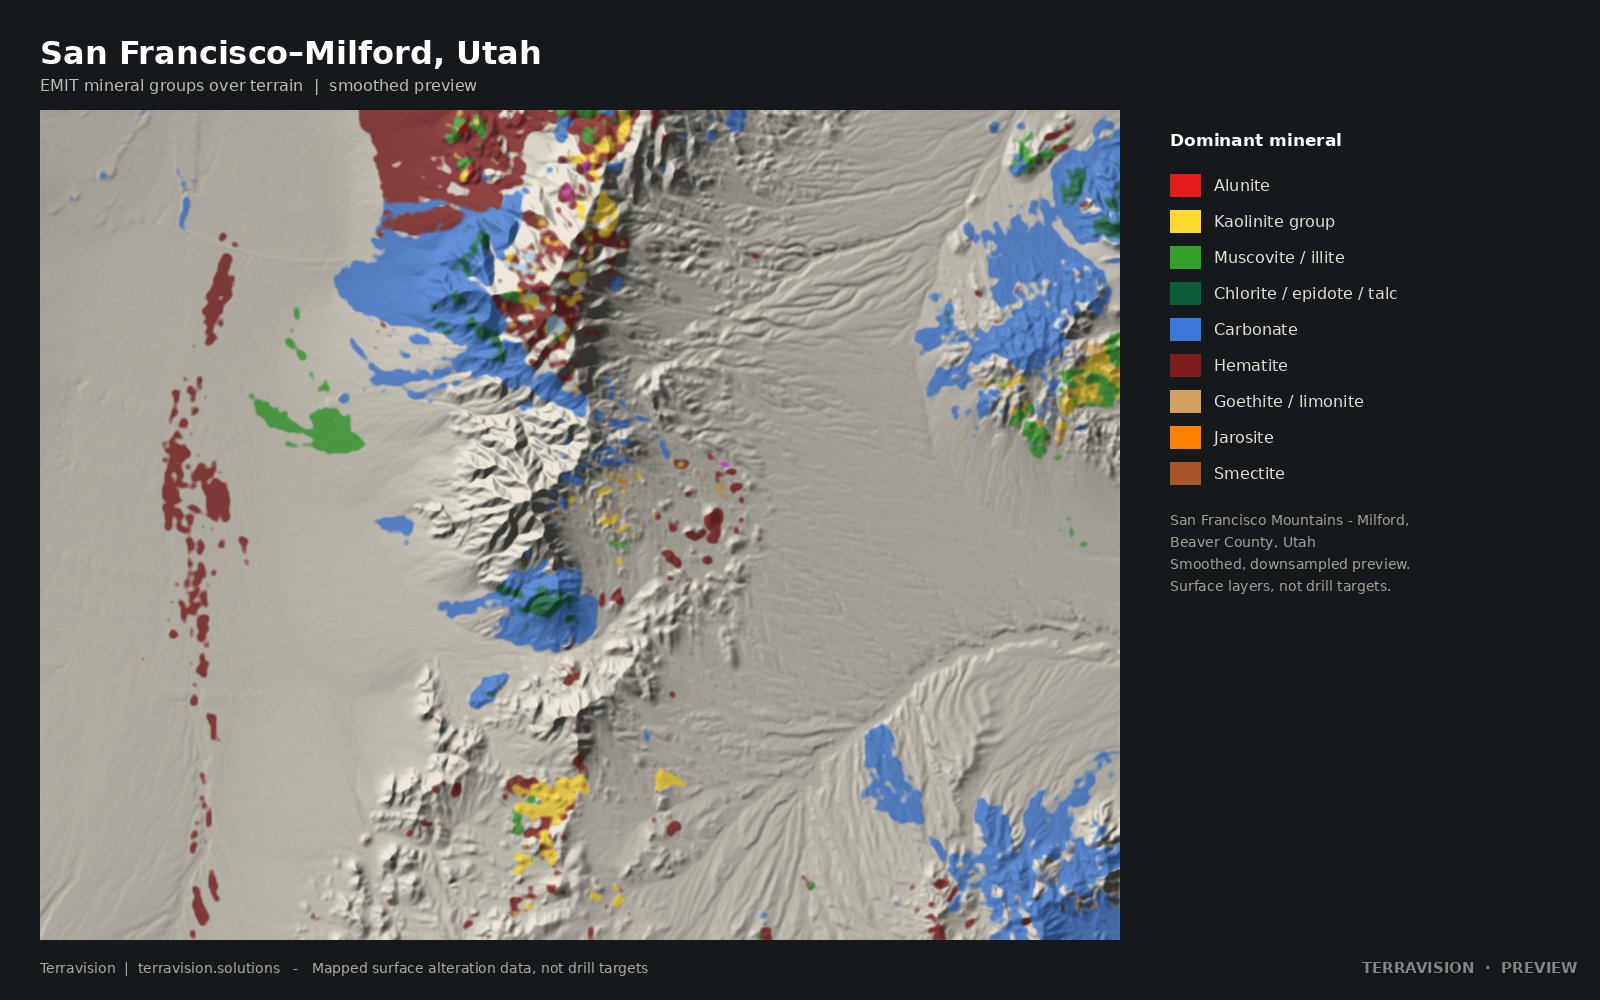
San Francisco–Milford, Utah
The San Francisco Mountains to Milford area of Beaver County: arid, well exposed and historically productive. EMIT minerals, mines, claims and no-go land.
$295 · team $795 · academic $99 · instant download
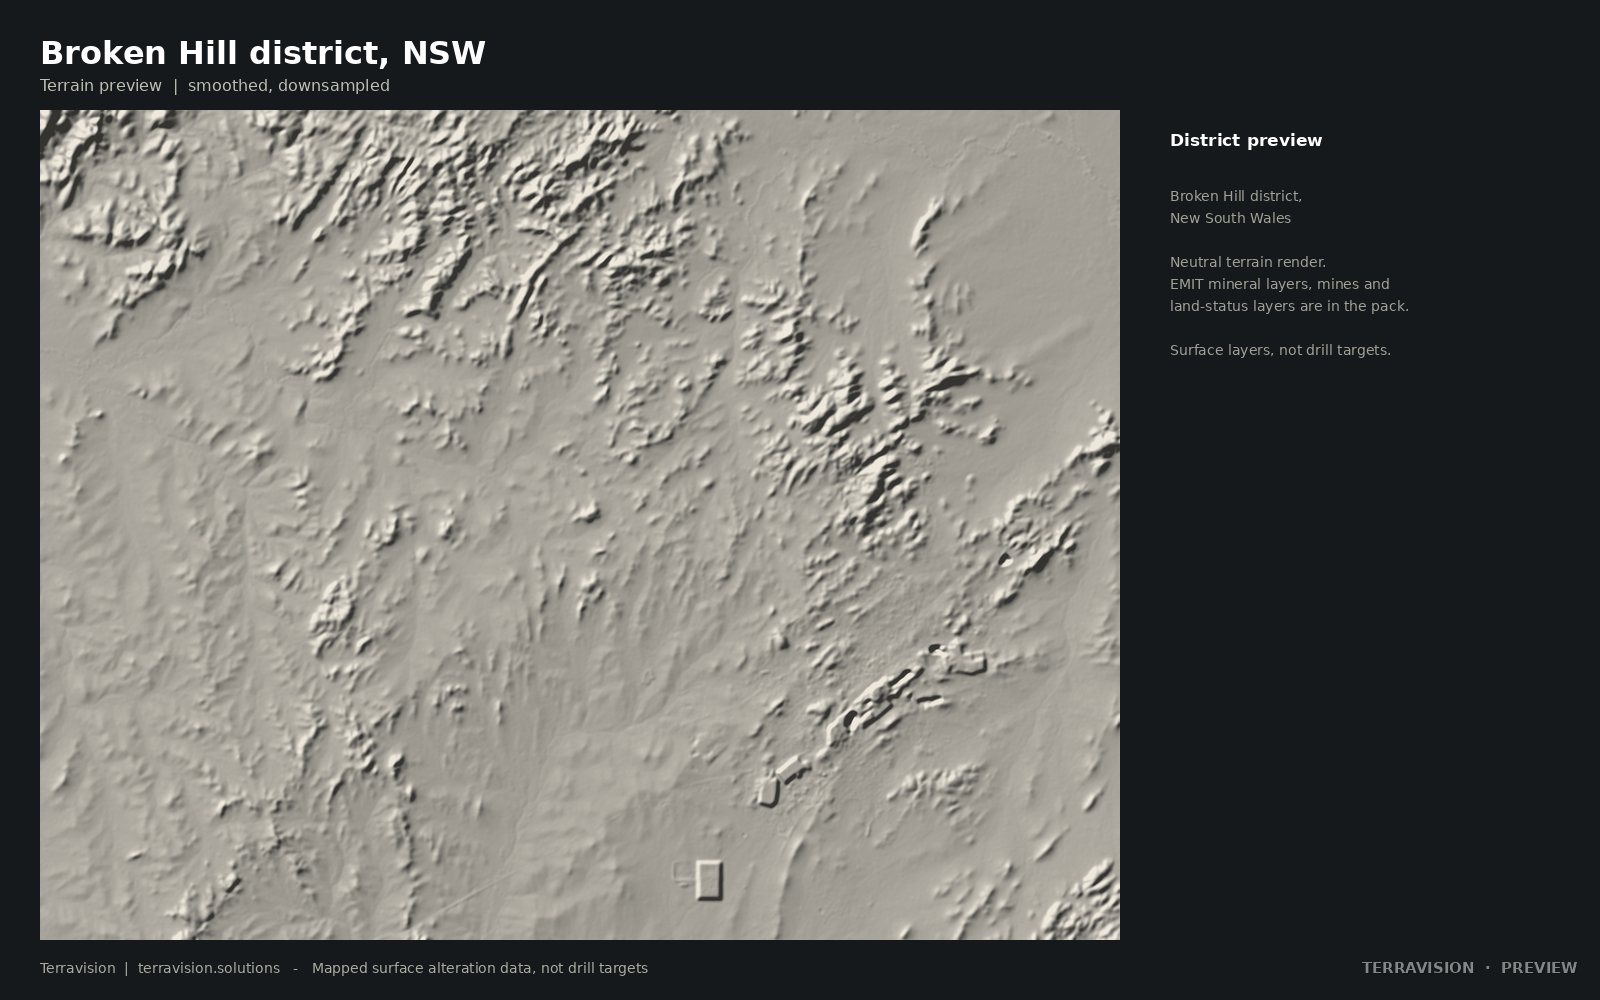
Broken Hill district, New South Wales
Far-west New South Wales: EMIT mineral layers, mineral occurrences, mining and exploration titles, and reserved and Indigenous-land layers.
$245 · team $595 · academic $99 · instant download
Unclaimed alteration targets, Nevada and Utah
A satellite screen of open BLM ground: alteration signatures with no recorded claims, each sold to one buyer. Introductory price $695 for a new buyer's first target, until 31 December 2026.
These are unclaimed alteration targets, not gold mines.
Surface alteration layers, not drill targets.
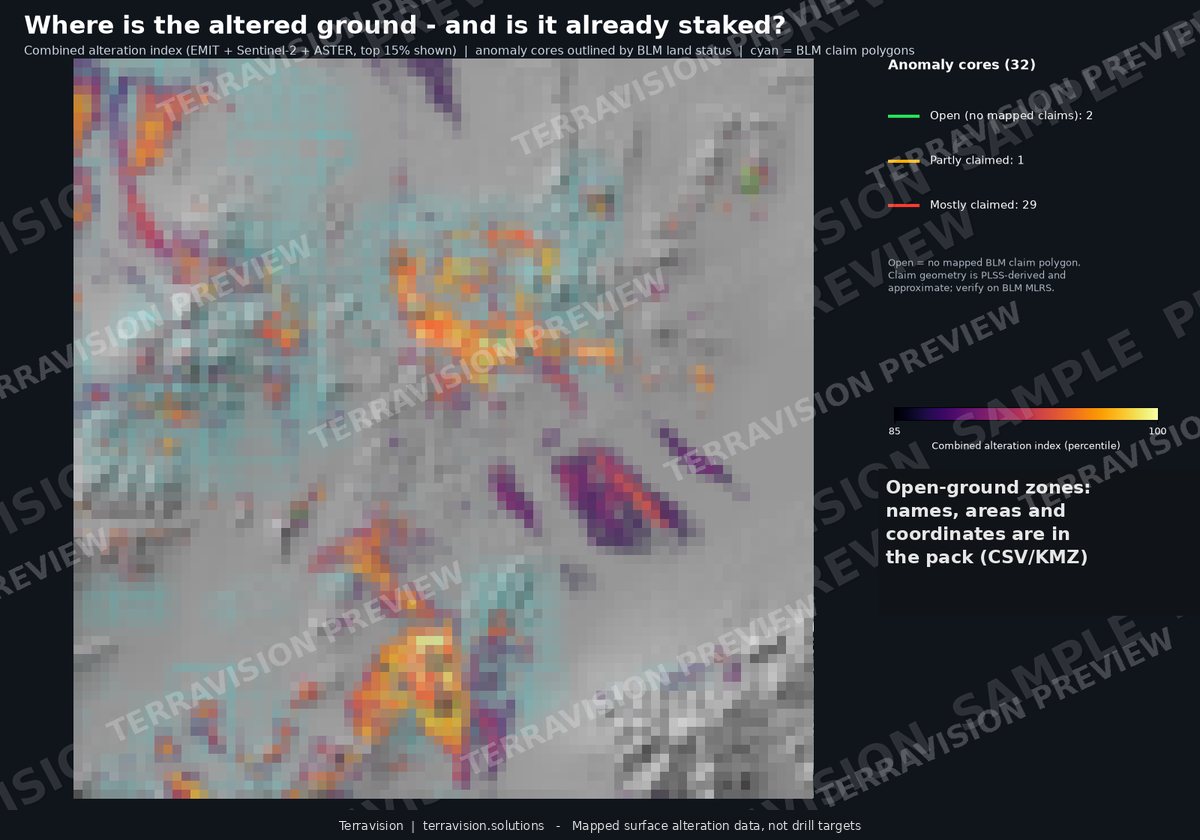
What the layers look like, at preview resolution.
These are deliberately coarse and watermarked. The pack carries the full-resolution rasters and vectors. They're here so you can judge whether the method is useful for ground you know.

Four steps, and the limits written down.
You send a boundary
A KML, a shapefile, corner coordinates or a marked-up map. We confirm within a few hours that the area is workable. Dense vegetation or permanent cloud defeats this method, and we'll tell you before we start.
We collect every usable look
All clear-sky EMIT acquisitions over the area, Sentinel-2 composites, and ASTER archive scenes. Repeat looks matter: a mineral that shows up in most of them is far more believable than one that shows once.
We map and score
Mineral groups from EMIT, iron and clay indices from the other sensors, and fault and lineament mapping from high-resolution terrain data.
You get files and a plain note
A Google Earth KMZ, a CSV with coordinates and scores, and a short written summary: what was found, what it might mean, and what it can't tell you.
Your ground, mapped properly.
For your own project area, we run the full process: ranked target zones, alteration layers and a written summary, delivered as a Google Earth KMZ plus a CSV of coordinates and scores. Delivery is within 48 hours of the boundary being confirmed.
| Option | Covers | Price |
|---|---|---|
| Small test See what the method shows on ground you know. Credited against a full order within 30 days. | One area up to 4 km² | $950 |
| Starter The full process for a single project area. | One area up to 100 km² | $3,300 |
| District programme Priority processing and direct consultation. Suits multi-claim portfolios. | Up to 5 parcels | On enquiry |
Introductory offer: first project for new clients $2,300.
Written up for mining and geothermal projects. Further services — lithium screening, due-diligence reports, InSAR monitoring, claim alerts, mine-waste mapping, site packs and 3D seismic interpretation — are on the services page, with prices in US dollars.
All prices in US dollars. If an area isn't workable we'll tell you before starting and refund you in full. Your data stays confidential and is never reused or shared.
Our own outputs, two ways.
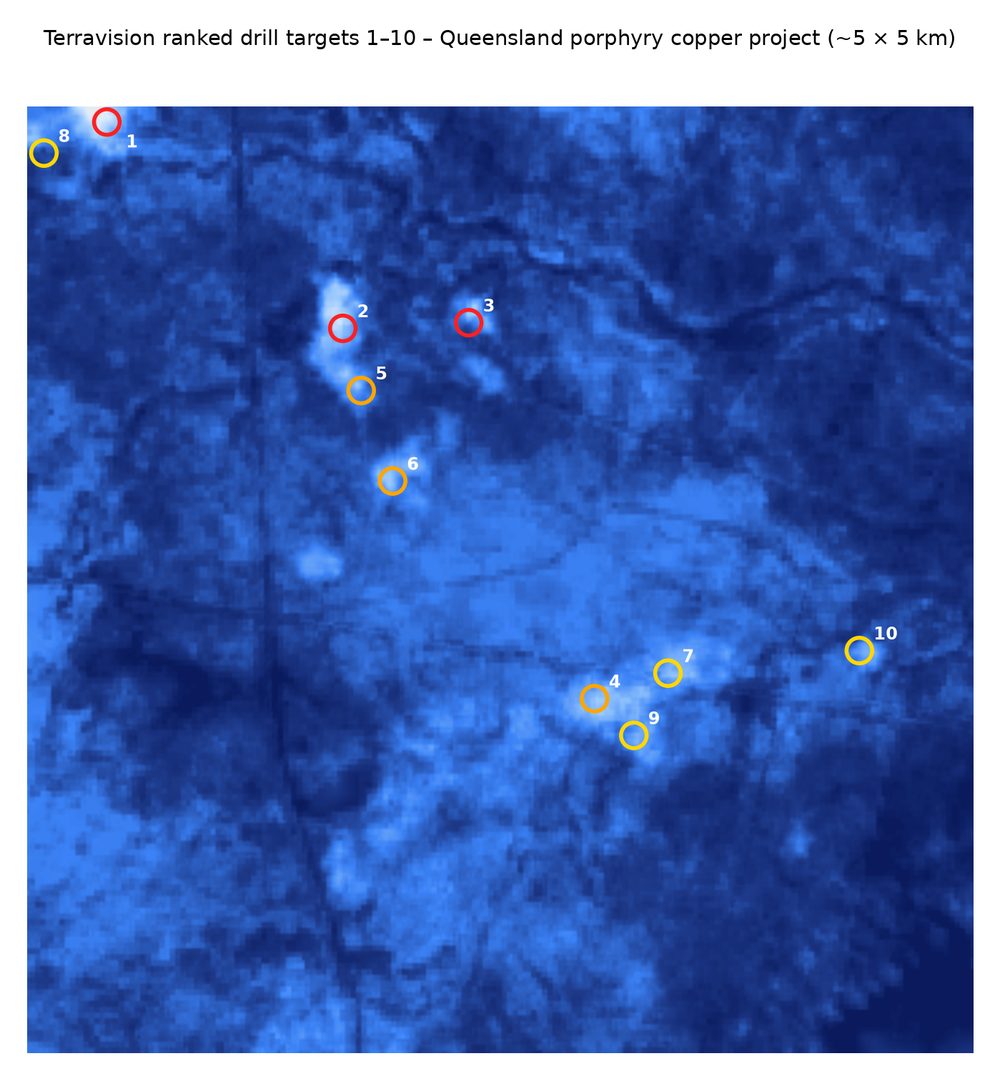
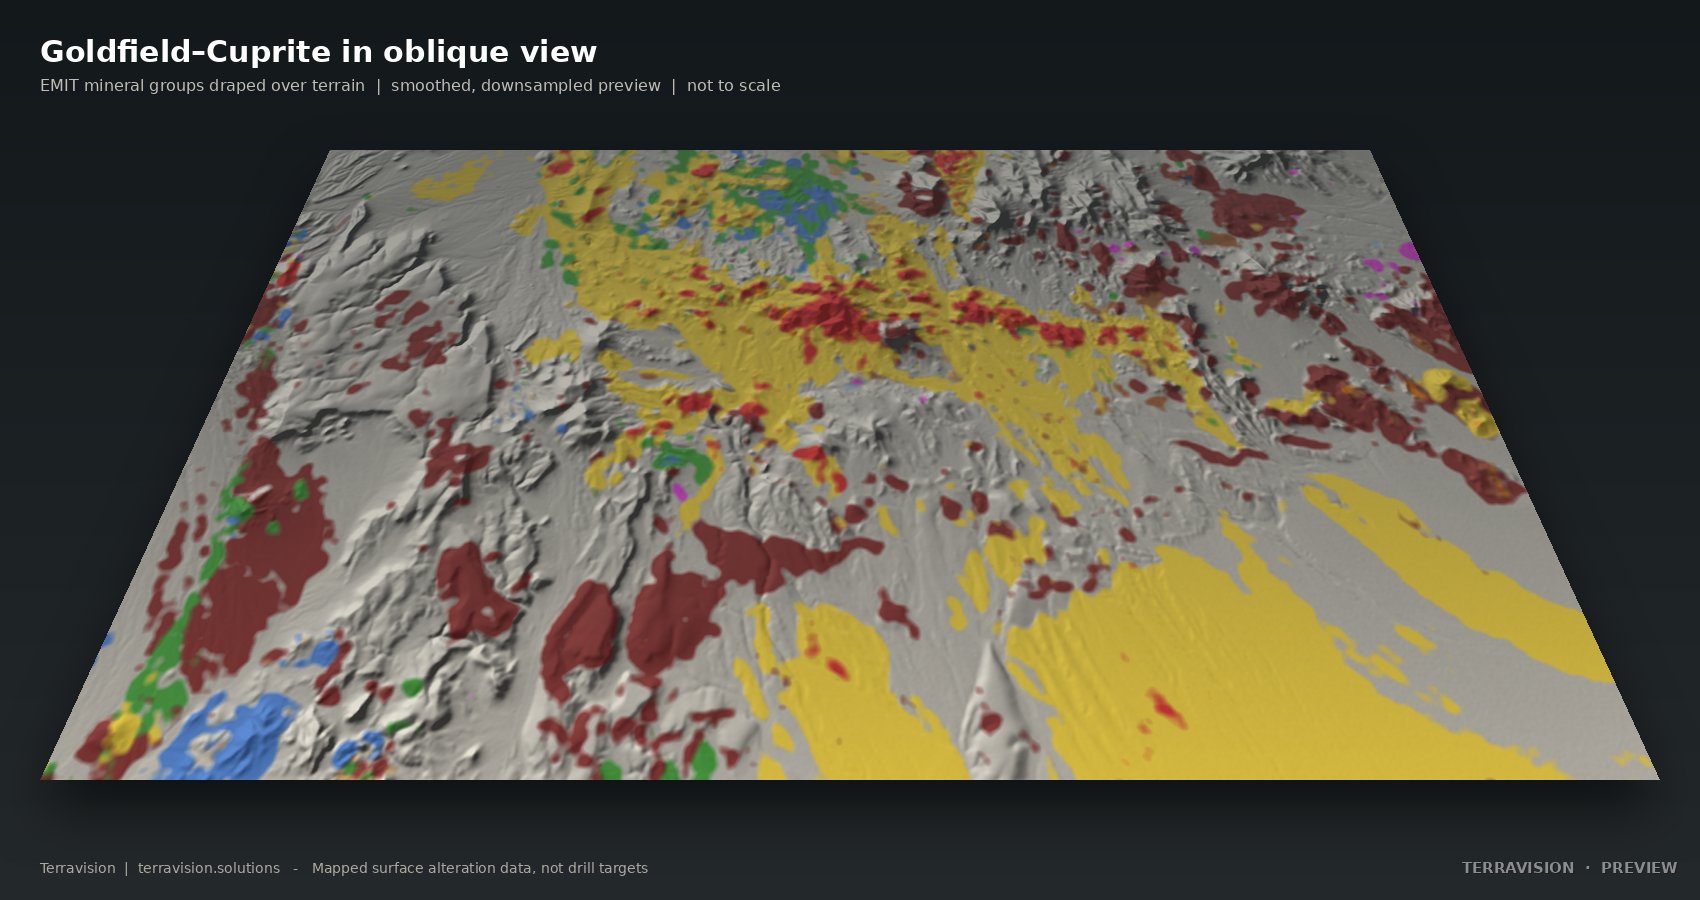
We'd rather you look at the maps and judge for yourself than take a claim from us. Send us ground you already know well, and compare what comes back with what you've seen.
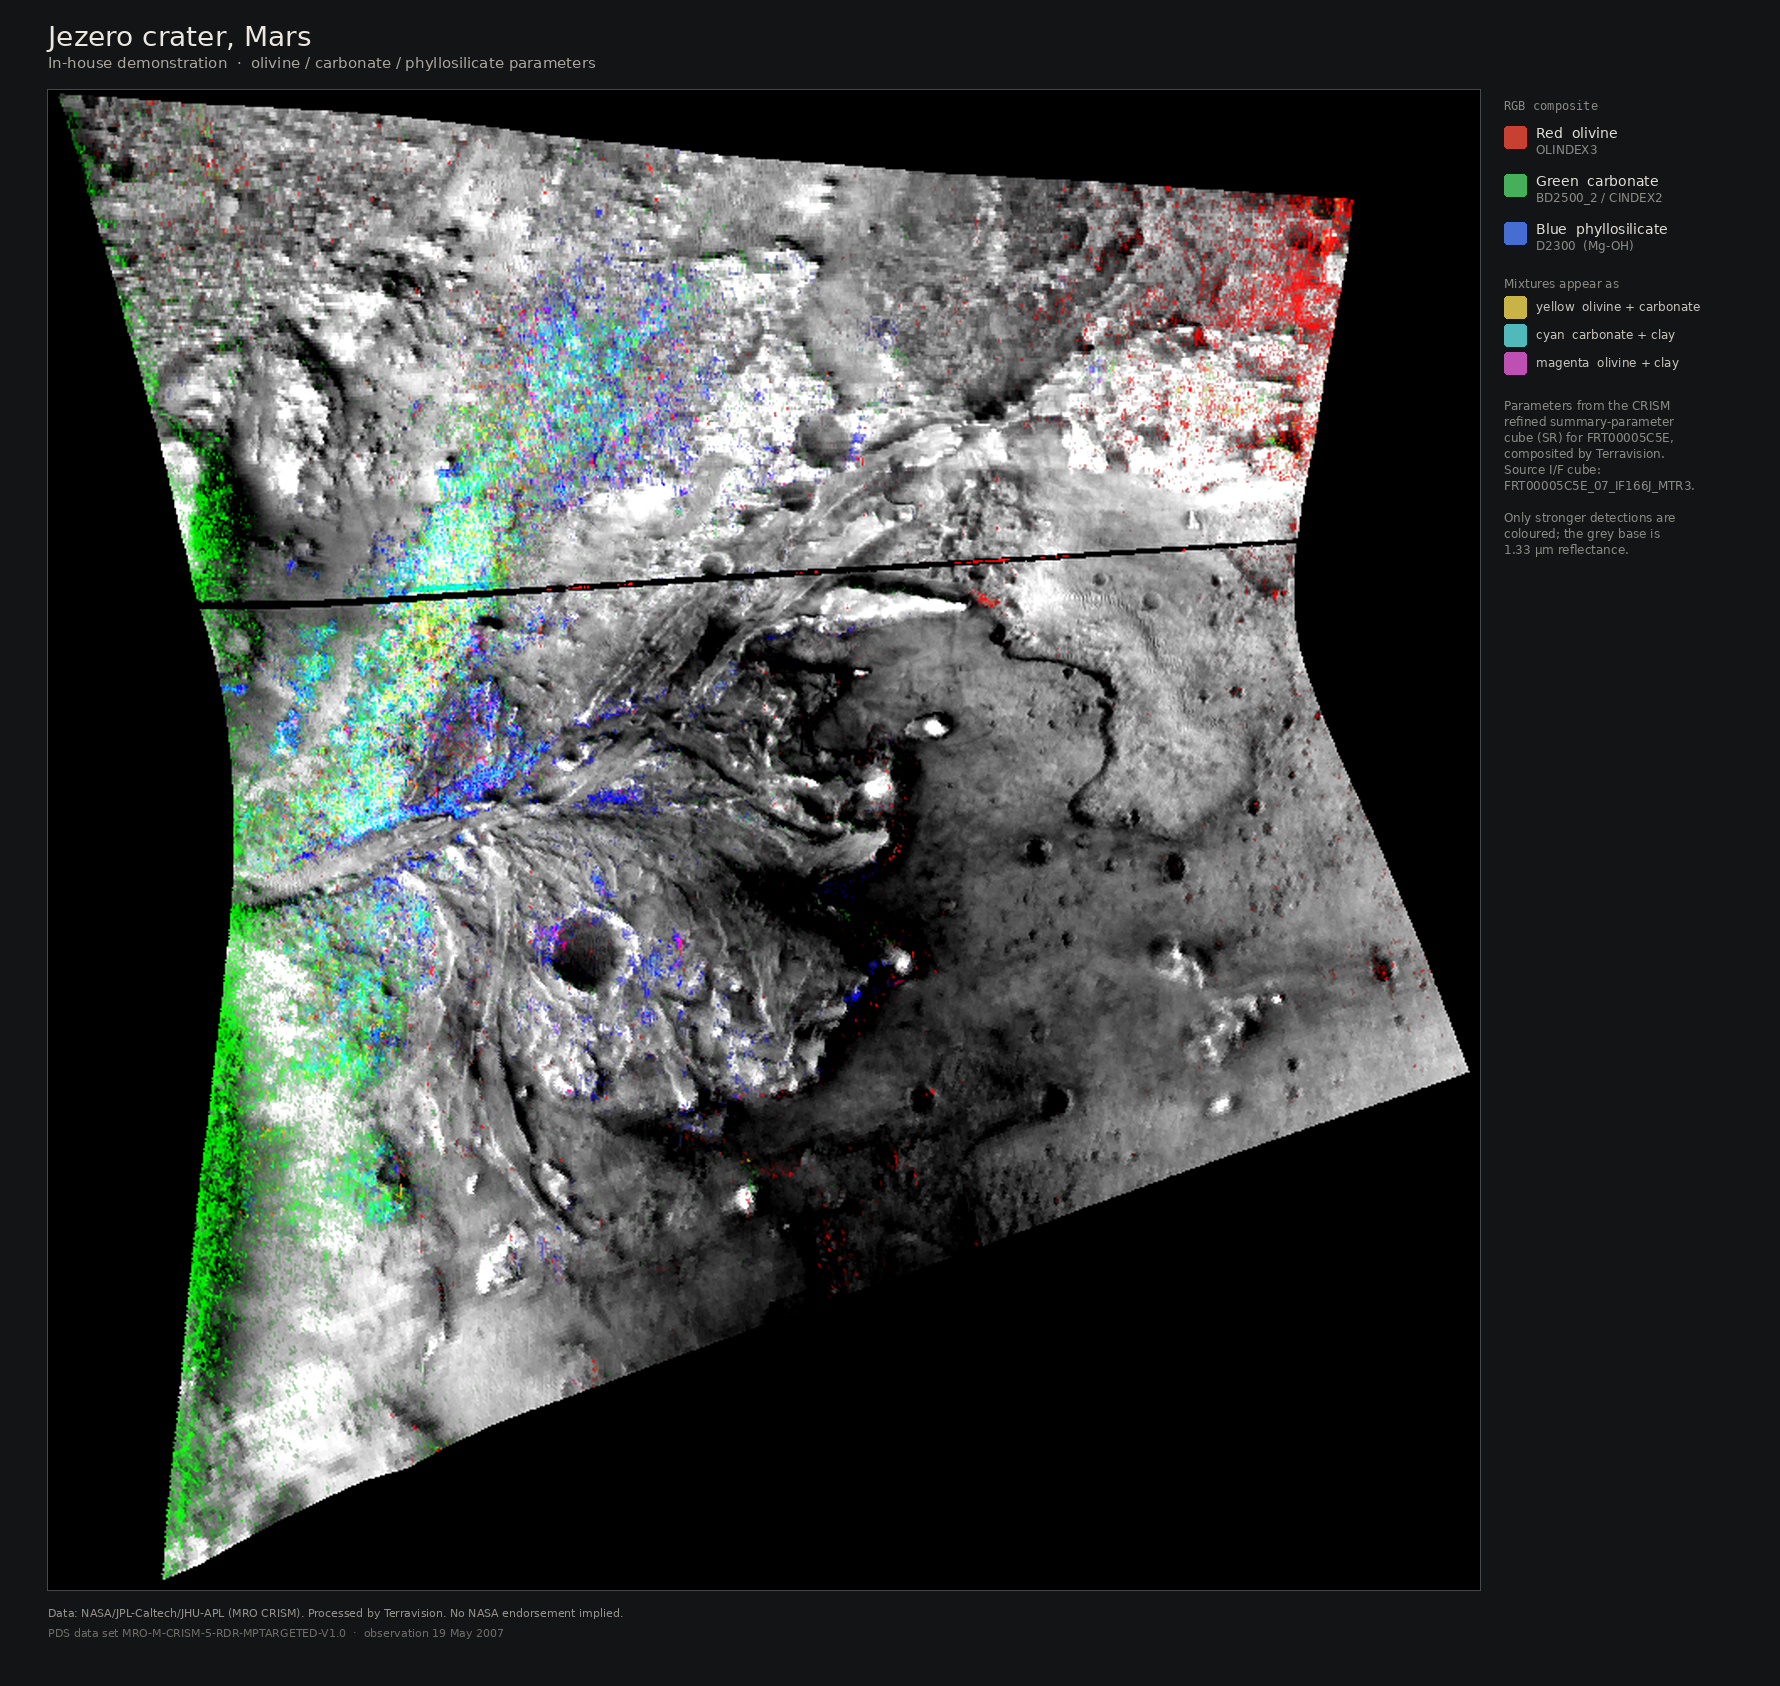
The same class of spectral methods used to map minerals on Mars, applied to Earth sensors.
This is an in-house demonstration, not a client project and not a NASA project. Terravision composited a public CRISM observation of Jezero crater, Mars, to show the family of spectral-parameter methods used on Earth sensors (ASTER, Sentinel-2, EnMAP, PRISMA).
A mapping service built on public satellite data.
Terravision turns open satellite data into practical exploration maps for mining and geothermal projects. The aim is simple: make it cheap and clear enough that looking from orbit first becomes the normal first step.
Data and method. We use NASA EMIT, ASTER and Sentinel-2 imagery, and map faults and lineaments from high-resolution terrain data, including LiDAR where it is available. Third-party data and licences are credited in every pack.
How we work. You send a boundary. We confirm the area is workable before we start, deliver within 48 hours, and include a plain note on what the maps show and what they can't. Your data stays confidential and is never reused or shared.
Tell us about your ground.
A rough location is enough to start. We reply to every enquiry, usually the same day, and tell you honestly whether the method suits your area.