
Terravision / Services / Geothermal InSAR monitoring / Brady pilot
A ground-movement baseline for a geothermal field: the Brady pilot.
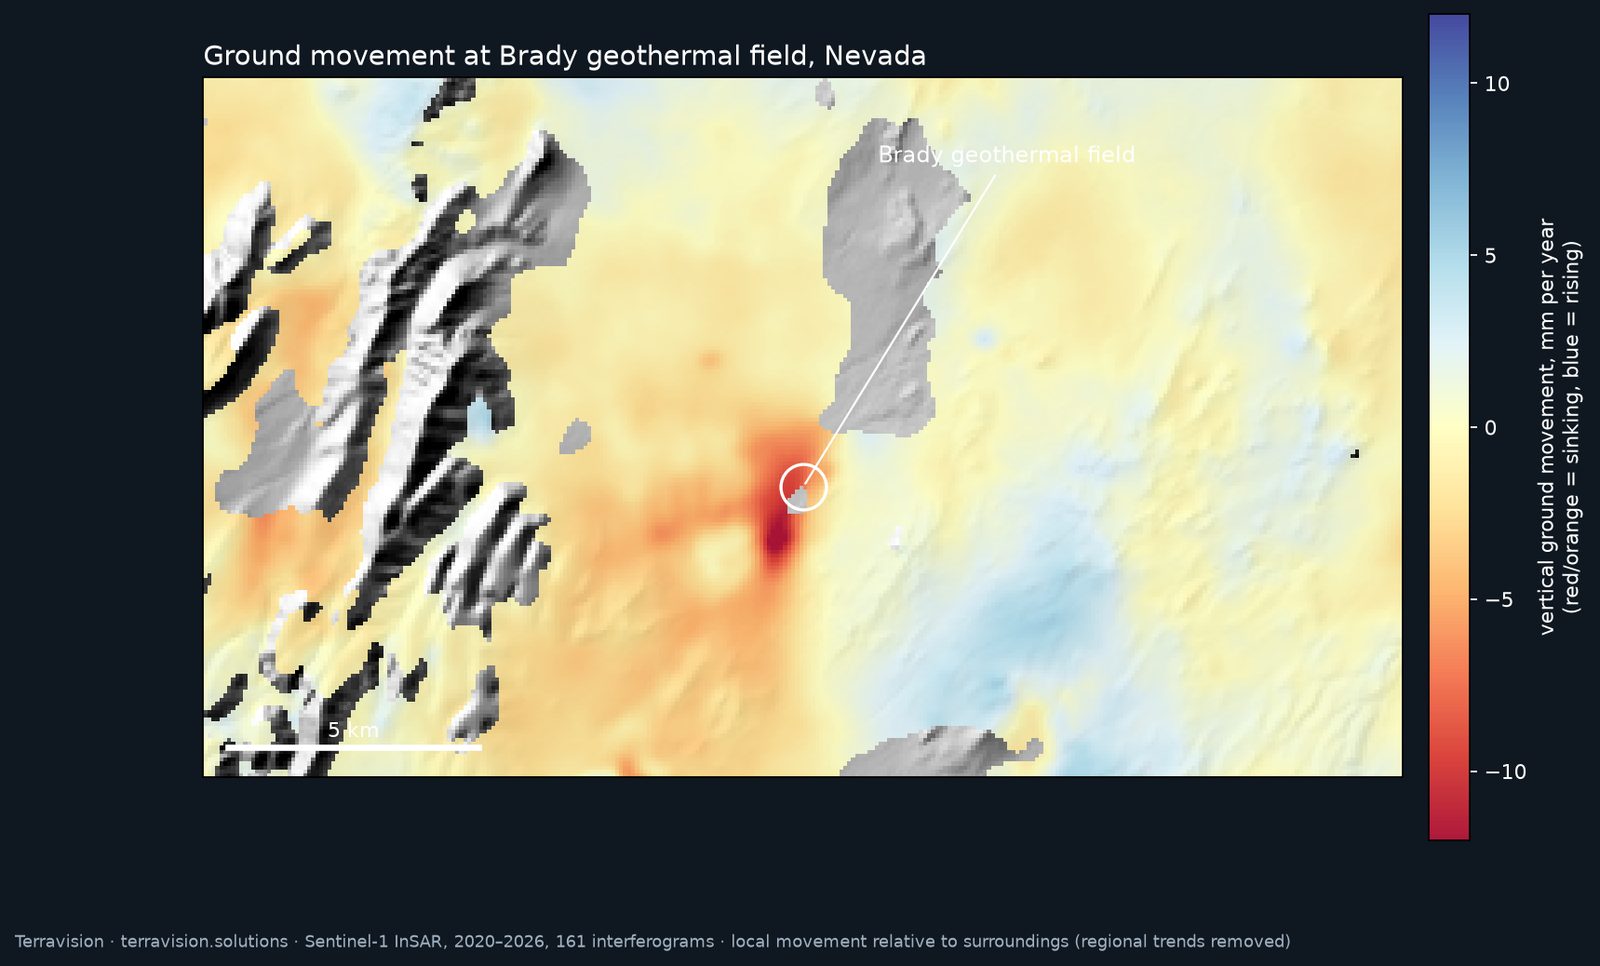
Geothermal production can lower the ground over a field, slowly. Satellite radar (InSAR) can show that movement without anyone going to site. To show what a baseline looks like, we ran a pilot at the Brady geothermal field in Nevada, using free Sentinel-1 data from 2020 to 2026.
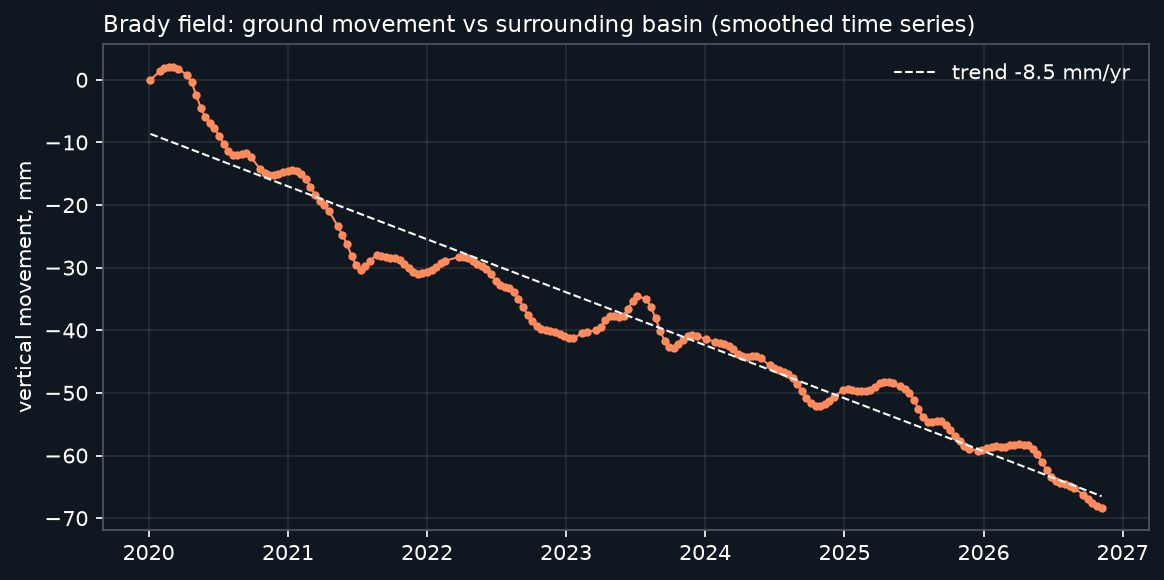
The pilot picked out the known production-related subsidence bowl at Brady, at about 8 to 14 mm a year, consistent with published work on the field. Noise in the result is a few mm a year, so we pitch this as a baseline plus monitoring, not precise millimetre mapping.
What we did
We processed 161 Sentinel-1 radar interferograms with ASF HyP3 and combined them into a rate of vertical movement and a time series for the field, then removed broad regional trends so that local movement stands out against its surroundings.
What this does and does not show
- It shows that free Sentinel-1 data can pick out a known production-related subsidence bowl, in the right place and at a rate consistent with published studies of the field.
- It is a single pilot, on a field where the answer was already known. It is a worked example, not a guarantee for another field. Dense vegetation, snow, steep terrain or very small movements can all limit what the archive can show, and we will say honestly whether the archive looks usable before you commit.
- It measures ground movement only. It is not a reservoir model and not a temperature or output forecast.
What a client receives
- Baseline report. A map of ground movement over your field and its surroundings for the archive period, a time series for the areas of interest, and a short note on what the data shows, how noisy it is and where it should not be trusted.
- Files. GeoTIFF rasters and a CSV time series for use in your own GIS.
- Monitoring. After a baseline, a monthly update that adds new acquisitions and flags change.
Prices
All prices in US dollars. The introductory rate is for a new client's first project and runs until 31 March 2027.
Contains modified Copernicus Sentinel data (2020–2026), processed with ASF HyP3.
Geothermal InSAR monitoring · Geothermal mapping · All services · Enquire
Have a field in mind?
Tell us where it is. We will say honestly whether the Sentinel-1 archive looks usable there before you commit to anything.