
Terravision / Validation
A held-out check at Goldfield, Nevada.
Before we offer a map as a way of choosing ground, we ought to say how it behaved on a district where the answer is already partly known. This is that write-up. It is a modest result, with real limits, and it is the result we are prepared to stand behind.
What we asked
We took the satellite alteration map for Goldfield–Cuprite — NASA EMIT, ASTER and Sentinel-2, combined into one alteration index — and compared it with USGS MRDS records of mines, prospects and occurrences in the same area. Those records were never used to build the score. To avoid counting a busy camp many times, we kept one point in each 2 km cell, which left 60 independent cells.
The question was simple: if you look only at the top 10% of the map, how many of those 60 cells fall inside it? On a map with no skill, you would expect about 10%. We also asked whether adding structure from terrain, a magnetic-low layer, or public sediment geochemistry improved that figure. A layer was to be kept only if it beat chance on its own and did not make the alteration result worse. That rule was fixed before we looked at the combined scores.
What we found
Satellite alteration alone put 23 of the 60 cells (38%) in the top 10% of the area. The 95% confidence interval is roughly 27–51%. The mean percentile of those cells on the alteration map was 0.69: on average they sat higher than a typical point in the district, without being perfectly separated from the rest of the ground.
The extra layers did not help. Structure alone matched chance (10%). Magnetics was worse. Geochemistry, on a thinner sample, was still below alteration on its own, and every combination of alteration plus one extra layer, or all of them together, came out at or below the 38% figure. Under the rule we had set, those layers were excluded. The map we use for targeting is the satellite alteration map, with fault and lineament mapping kept as context and as a filter, not as a term in the score.
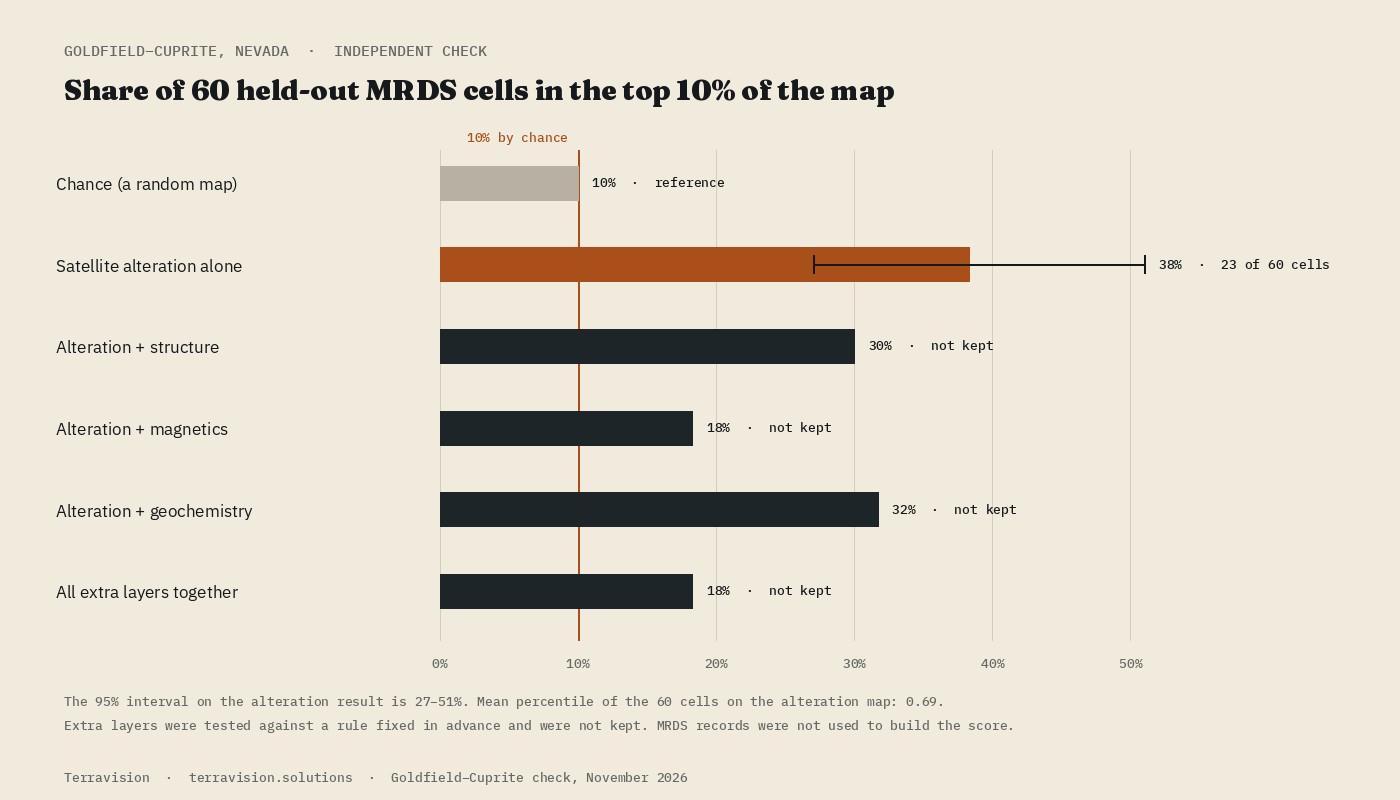
| Layer | Cells in the top 10% | Hit rate | Kept? |
|---|---|---|---|
| Chance | 6 in 60, expected | 10% | — |
| Satellite alteration | 23 in 60 | 38% (27–51%) | Yes |
| Alteration + structure | 18 in 60 | 30% | No |
| Alteration + magnetics | 11 in 60 | 18% | No |
| Alteration + geochemistry | 19 in 60 | 32% | No |
| All extra layers together | 11 in 60 | 18% | No |
Caveats, which matter as much as the headline
Sixty cells is a small sample. The interval around 38% is wide, and a different district could come out lower. The test is also partly circular: Goldfield is a famous camp, and mine workings, dumps and disturbed ground often show iron oxides and clays at the surface. A satellite map will naturally light up around known mines. That is useful if you are asking “does the method see alteration where we already know there was hydrothermal activity?”, and it is a poor basis for claiming that the same rate would hold on unworked ground.
MRDS itself is uneven. Records include prospects and past producers as well as better-documented mines, and they cluster. Declustered cells are a fairer unit than raw points; quoting the raw 459 records would have made the numbers look much stronger, and would have been misleading. We have not turned this into a deposit model, a grade prediction or a success rate for new discoveries. We do not have a figure for how often an unclaimed alteration target becomes a mine, and we will not invent one.
What we do with this
We treat the alteration map as a way of deciding where to spend field days, and we say so on every delivery. Structure from terrain still goes out with the files, because faults and lineaments are worth having on the ground, even though they did not improve this particular score. Gravity, magnetics and a machine-learning fusion of those layers are not part of the product, because they did not earn their place on this test.
If you want to judge the layers yourself, the Goldfield–Cuprite pack is the public, documented version of the same district. For how the sensors differ, there is a short note on EMIT, ASTER and Sentinel-2.
Surface alteration layers, not drill targets. November 2026.