19 November 2026 · Terravision · 8 min read
How to read a satellite alteration map
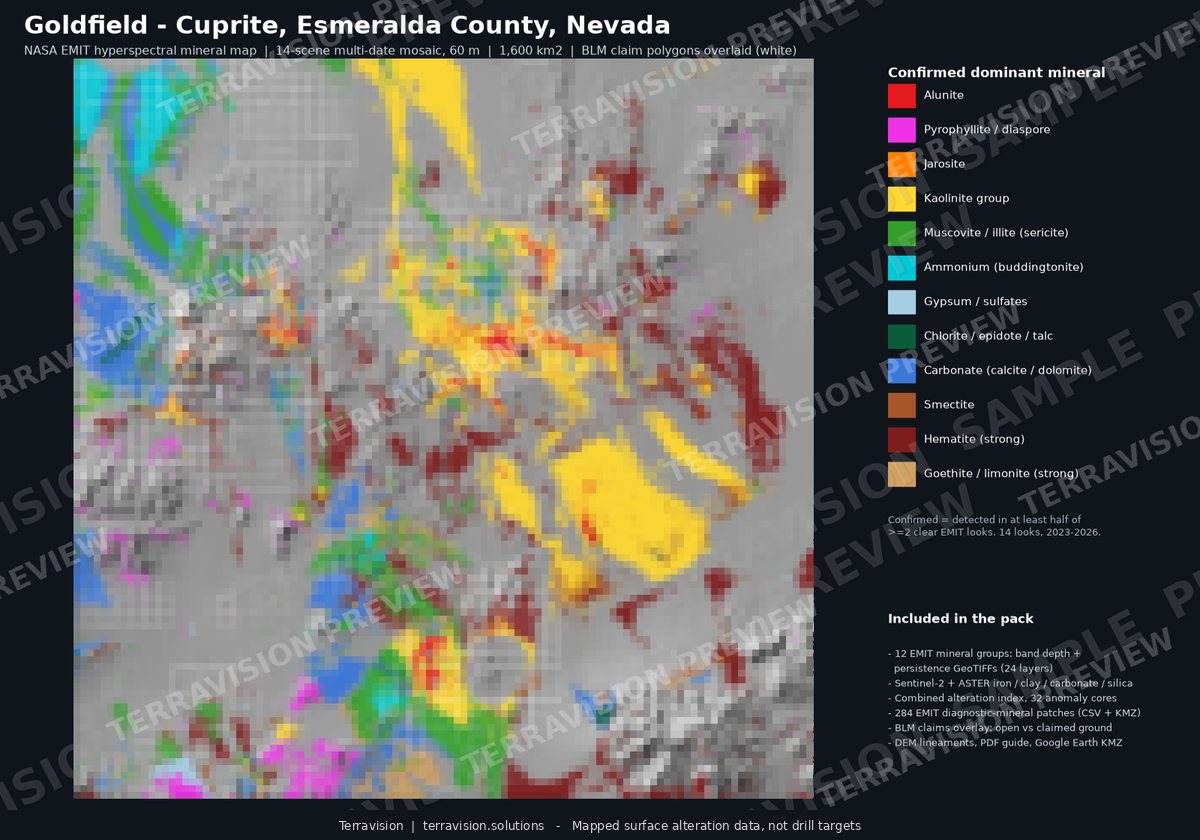
A satellite alteration map is easy to misread. The colours look decisive, the minerals have proper names, and it is tempting to treat a strong patch as a target ready for a drill. Used carefully, the same map is a good way of deciding where to walk. This note is about how we read our own maps, and the mistakes we try not to make.
What the colours usually mean
Most of the maps on this site show one of two things. A dominant-mineral view colours each pixel by the alteration mineral that is strongest there, once it has passed a confirmation test. A band-depth or index view shows how strong a particular mineral's absorption is, without forcing a single name on the pixel. Both are useful, and they answer different questions. The first is a legend you can read at a glance: kaolinite here, alunite there, iron oxides along a ridge. The second is better when you want to know whether a signature is strong or barely there.
The minerals we can name from orbit are the ones with a distinct shortwave-infrared or visible absorption: clays such as kaolinite, smectite and illite or muscovite; sulphates such as alunite and jarosite; iron oxides such as hematite and goethite; and, in some places, carbonates, gypsum or silica. That list is already a limit. The sensors do not see gold, copper or lithium as metals. They see the alteration that sometimes sits above or around those systems.
Pixels are mixed, and size matters
NASA EMIT, which does the mineral identification, has a ground size of about 60 metres. In one pixel you may have rock, soil, a track, a little vegetation and a wash. The spectrum is a mixture. A narrow vein can be diluted to the point where it disappears; a broad, weakly altered slope can look stronger than a tight, genuine zone. Sentinel-2 and ASTER are finer or similar, but their bands are coarser, so they are better at “something clay-like” or “iron staining” than at naming the mineral.
We treat a mineral as confirmed only when it shows up in repeat looks, on different dates, and we say so in the legend or the method note. A one-scene detection can be noise, residual cloud, or a quirk of illumination. Persistence is not proof, but it is a better reason to walk a patch than a single colourful pixel.
What the map cannot see
These sensors see the top few micrometres of the surface. Alluvium, soil, dense vegetation, snow, water and desert varnish hide whatever sits underneath. A blank area is not “unaltered rock”. It may be covered. In basins this matters a great deal: the playa or the gravel fan can bury the altered bedrock you actually care about, and the map will only show you the cover.
Clay-rich soils, weathered carbonate and some basin-fill sediments can also look like hydrothermal clay. That is a false positive, not a conspiracy in the data. We try to flag it, and we would rather you treat a surprising clay patch on flat, soil-covered ground with suspicion until someone has stood on it.
How to sit the map against other information
The useful question is rarely “is this pixel interesting?” It is “is this altered ground already staked, already mined, or sitting on land you cannot work?” That is why our district packs carry claims, land status and recorded mines alongside the minerals. A strong alunite zone on open ground is a different conversation from the same zone in the middle of an active claim block or a wilderness withdrawal.
Structure helps in the same way. Faults and lineaments from high-resolution terrain data do not prove a deposit, and in a test at Goldfield they did not improve a simple score of known occurrences. They are still worth having on the map, because they are what you will see in the field: a scarp, a contact, a place where fluids might have moved. Use them as context, not as a second magic layer.
Previews are not the product
The figures on the website are deliberately coarse and watermarked, so you can judge the method without receiving the file you have paid for. The pack or the custom delivery carries the full-resolution rasters and the vectors. If a preview looks blocky, that is by design. If a colour in a preview seems to stop short of a contact you know, check the delivered layer before you draw a conclusion.
A short way to brief yourself
Read the legend first, then the method note, then the map. Ask what was confirmed in more than one scene. Ask what is cover. Compare the alteration with claims, mines and structure. Then decide where a field day would actually change your mind. A satellite map that sends you to the right ridge, and keeps you off the wrong one, has done its job. A map that claims to have picked a drill hole has overreached.
If you want a worked example, the Goldfield–Cuprite pack is a documented district where the geology is already well known, and there is an honest write-up of a held-out check on that ground. For the differences between the sensors, see EMIT versus ASTER versus Sentinel-2.
Mapped surface alteration layers, not drill targets.